Key Differences Between Winchester Boulevard and Ocala Avenue
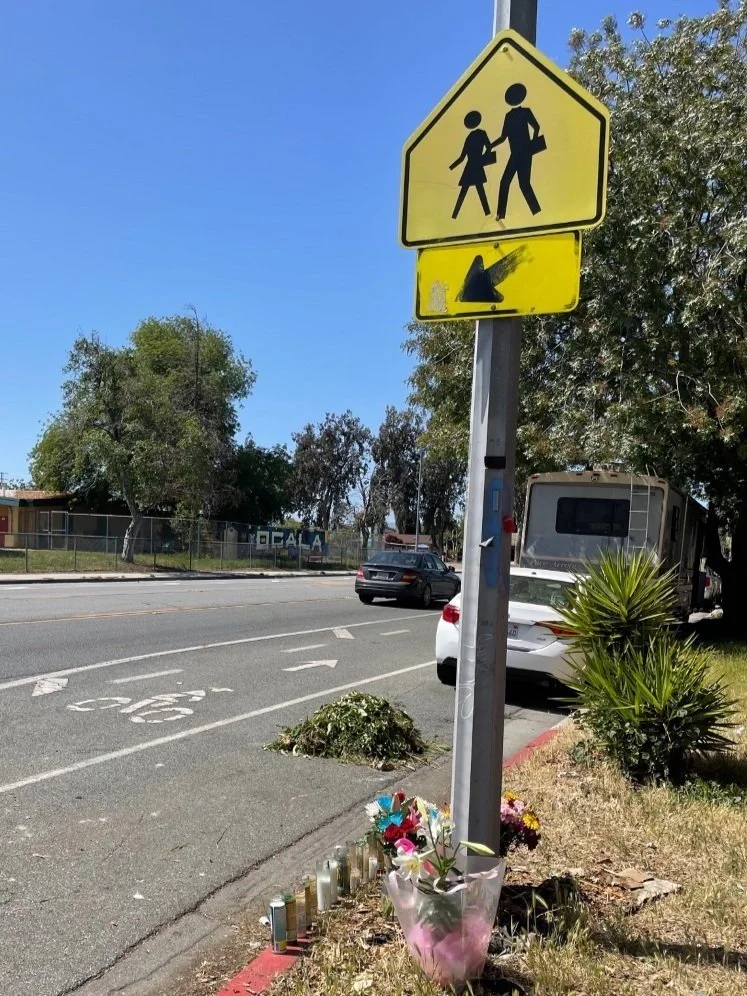
Small memorial to Narinder and Kuljit.
In early April, 75-year-old Narinder Kaur and her 53-year-old daughter, Kuljit Kaur were run over by a person driving a truck while attempting to walk across Ocala Avenue in San Jose. A small memorial has been placed at the site and candles continue to burn in memory of the mother and daughter.
The SVBC family mourns this tragic loss and as we do far too often, most recently with the death of 13-year old George "Andre" Oseida, we ask ourselves, what do we need to do to make the streets safe?
Let’s talk about this question in the context of the shiny new bike lanes on Winchester Boulevard in Los Gatos.
But first, a word of caution. This blog gets into the weeds a bit. It can be hard visualizing street designs, especially if you’re not familiar with the area, but if you’re interested in learning about design specifics, stick with it. We’ve included a bunch of pictures to help.
Winchester Boulevard in Los Gatos
Winchester Boulevard is an extremely wide, mostly residential street. For years it looked like this: one lane southbound, two lanes northbound, a center turn lane, on-street parking, lots of extra pavement, some white lines sort of marking a bike lane, occasional sidewalks, and 1.2 miles between two crosswalks. Cars routinely exceeded 40mph and anyone observing the speed limit of 25 and 35mph would be aggressively passed by other drivers.

Today, parking protected bike lane and bollards are on Winchester.
With a PG&E project and required repaving of Winchester, the opportunity arose to put in quick-build bike lanes, the first step in the Complete Streets vision for Winchester. Fast forward to today and Winchester consists of one lane in each direction, protected bike lanes along the curbs, and car parking moved to the space between bike lanes and car lanes, (what we call parking protected bike lanes.) Sporadically there are bright green bollards too.
I recently experienced this new infrastructure on a ride with a friend who lives near the area. The design caused me to reflect on the location of the murder of Narinder and Kuljit as Ocala’s striping is a little similar to Winchester – a buffered bike lane in each direction with a center turning lane in addition to on-street parking. As we pedaled up Winchester, no one was speeding. Why not?
The Plot Thickens…
Here’s another interesting part of the story. My friend mentioned that they drive this section of Winchester frequently. During a two week period, post-buffered bike lane installation but pre-bollard, (are you still following with all this jargon?) they were ticketed twice for speeding. But when the bollards went in, they started obeying the law.
The design of the street caused my friend to drive the speed limit. The lanes FEEL much narrower with bollards and parked cars alongside. That in turn forces drivers to pay attention and slow down.
Ocala Ave in East San Jose
Ocala is a very wide street too and acts as a barrier between several schools/recreational areas and a residential neighborhood. The street is a straight shot, serving as a direct east/west connection for residents in East San Jose.
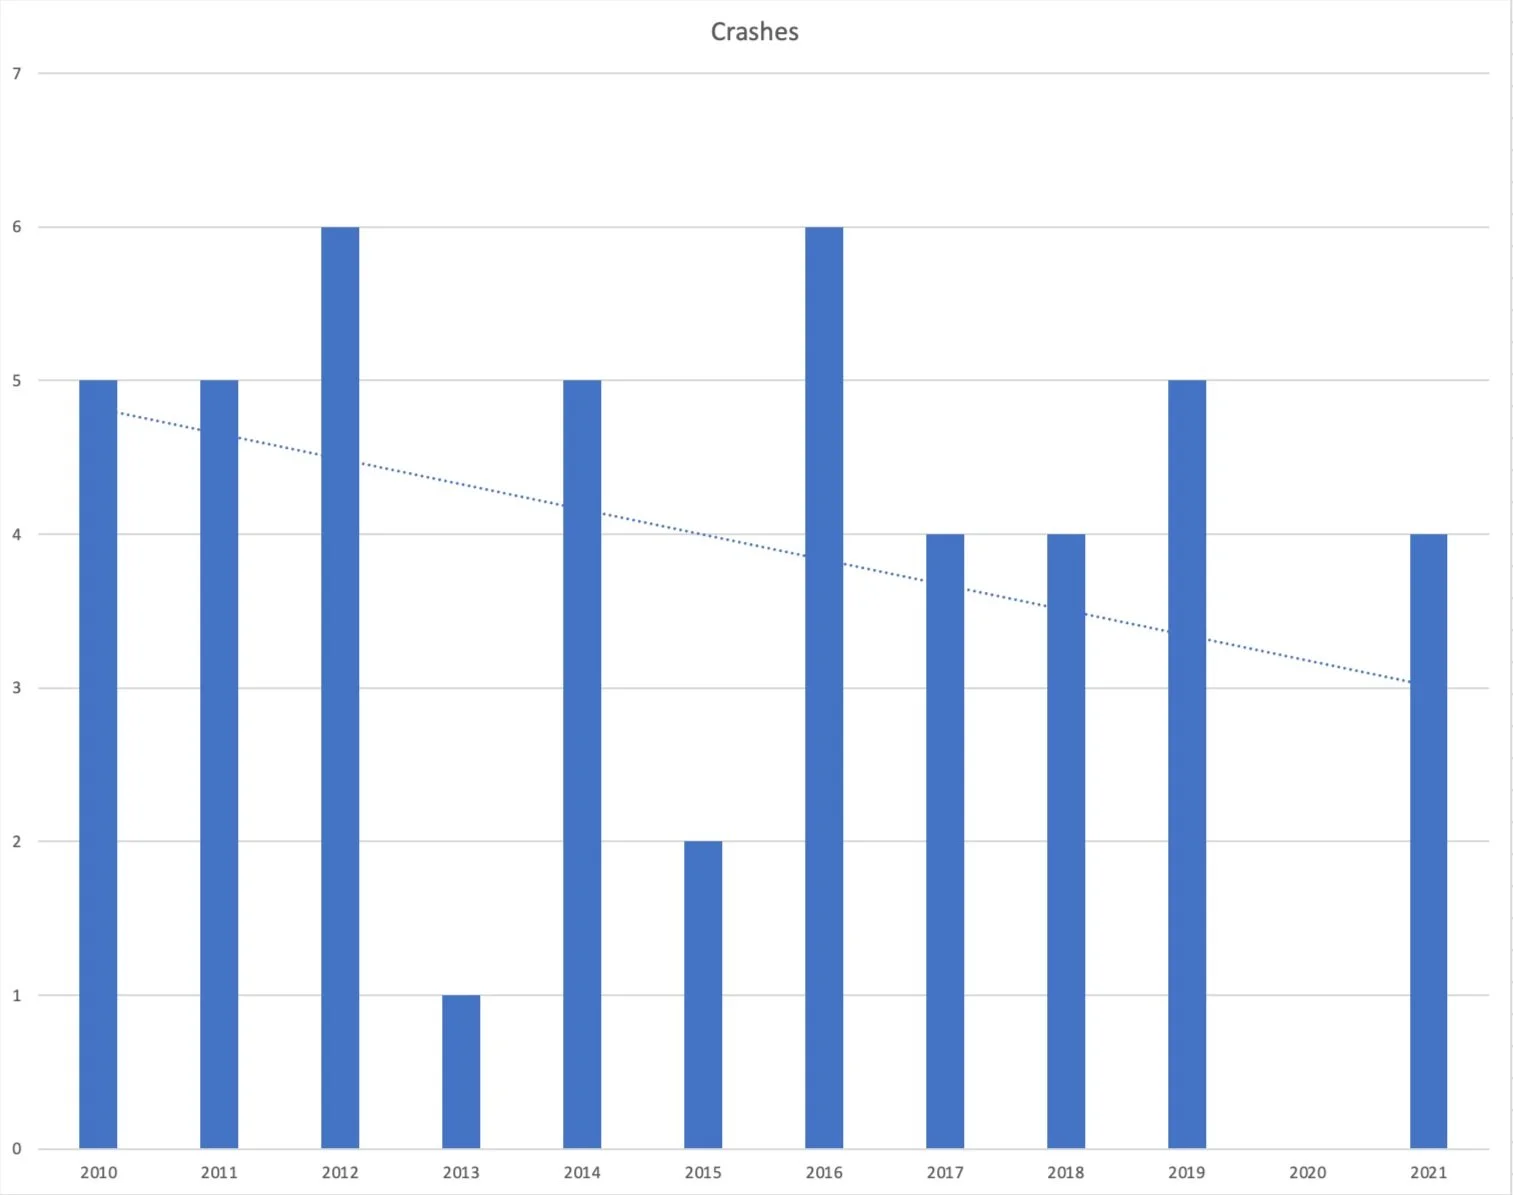
Crash numbers for pedestrians and bicyclists on Ocala. Notice in 2020, the number was zero. This was during the pandemic when driving dramatically decreased and walking and biking increased.
The City had previously identified it as an important corridor due to the high number of crashes. In fact, between 2010 and 2021, there have been 47 crashes on this short 2-mile stretch of Ocala between White and King, the vast majority due to speeding and failing to yield to pedestrians.
About four years ago, the City invested in new designs, bright yellow crosswalks, blinking lights called Rectangular Rapid Flashing Beacons (RRFBs), electronic signs that flash “slow down” when people are exceeding the speed limit and a few hardscape improvements to shorten pedestrian crossing distances. Those measures are good but failed to protect Narinder and Kuljit.
I rode Ocala and sat for a while observing how traffic behaves. There were many people who drove the speed limit. But often, as I sat under an electronic sign, it flashed speeds in excess of 40 mph. I also saw several people crossing the street. There are 10 pedestrian crossings on the 2-mile stretch between White and King.
Concrete Makes a Difference
“Physical obstacles or borders cause different driving behaviors.”
Here’s a little more to the story. On a short section of Ocala across from Reid Hillview Airport, traffic behaved a little better and people seemed to slow down. What was the difference? There, instead of a center turning lane, a concrete center median was built. Driving close to a concrete median caused people to drive more slowly.
Going back to the experience of my friend on Winchester Blvd, it was after the bollards were erected that they started to drive the speed limit. Physical obstacles or borders cause different driving behaviors.
Regardless, Ocala is wide and straight, two elements that invite speeding. The fact that one side has schools/recreation, and the other, families trying to get there along with several schools in the immediate vicinity; this is enough to warrant dramatic street changes that prioritize safety, now. Couple that with the fact that there are no really good east/west routes from East San Jose and there is a strong argument for the City investing in something extra special in this area. Fortunately, there are a few opportunities to leverage right now:
- A segment of Ocala is scheduled to be repaved in 2024
- There are surrounding streets that are scheduled for repaving this year
- And, longer term, if Reid Hillview Airport closes under the leadership of Supervisor Cindy Chavez, there will be an opportunity to transition the streets in this area to serve a vibrant redevelopment of the property that builds on all the great things already going on in the area
In the very least, narrow the street dramatically for a longer stretch of Ocala, and deploy proven methods that slow people down and force them to pay attention, like bollards and parking protected bike lanes. And ask the people who live there how to make the streets more safe as they are the ones who know the most about the behavior of drivers on Ocala.

Ocala Avenue across from Reid Hillview. Here, cars are sandwiched between a buffered bike lane and a concrete median. Traffic seemed to slow down in this location compared to further up, the site of the fatalities.
What You Can Do
Right now, there is a small but vocal minority of drivers who are pressing the Los Gatos Town Council to stop putting in more green paint, bike lanes, and bollards. And in San Jose projects that are in the works, such as McKee and Julian, run the risk of getting watered down because drivers honk at their councilmembers and their councilmembers cave.
This story happens everywhere. Any given Tuesday night, a City Council is faced with a council chamber full of angry drivers, all complaining that the removal of on-street parking, the inclusion of bike lanes, the widening of sidewalks, will slow down their ability to get from A to B as fast as they think they deserve. The end result is people die.
Please show up. Get involved. Push your elected representatives to design streets with safety of bicyclists and pedestrians in mind. It makes the streets safe for everyone. Click here to get involved.
Thank you to Bobby Gonzalez for contributing data, analysis and the perspective of someone who grew up in the area for this blog.